If It’s Not the Price of Fruit, What Is It?
U.S. fruit adherence collapses with age, not income — and the number everyone reports hides both. And none of the numbers do justice to the complexities of age as a social and biological variable.
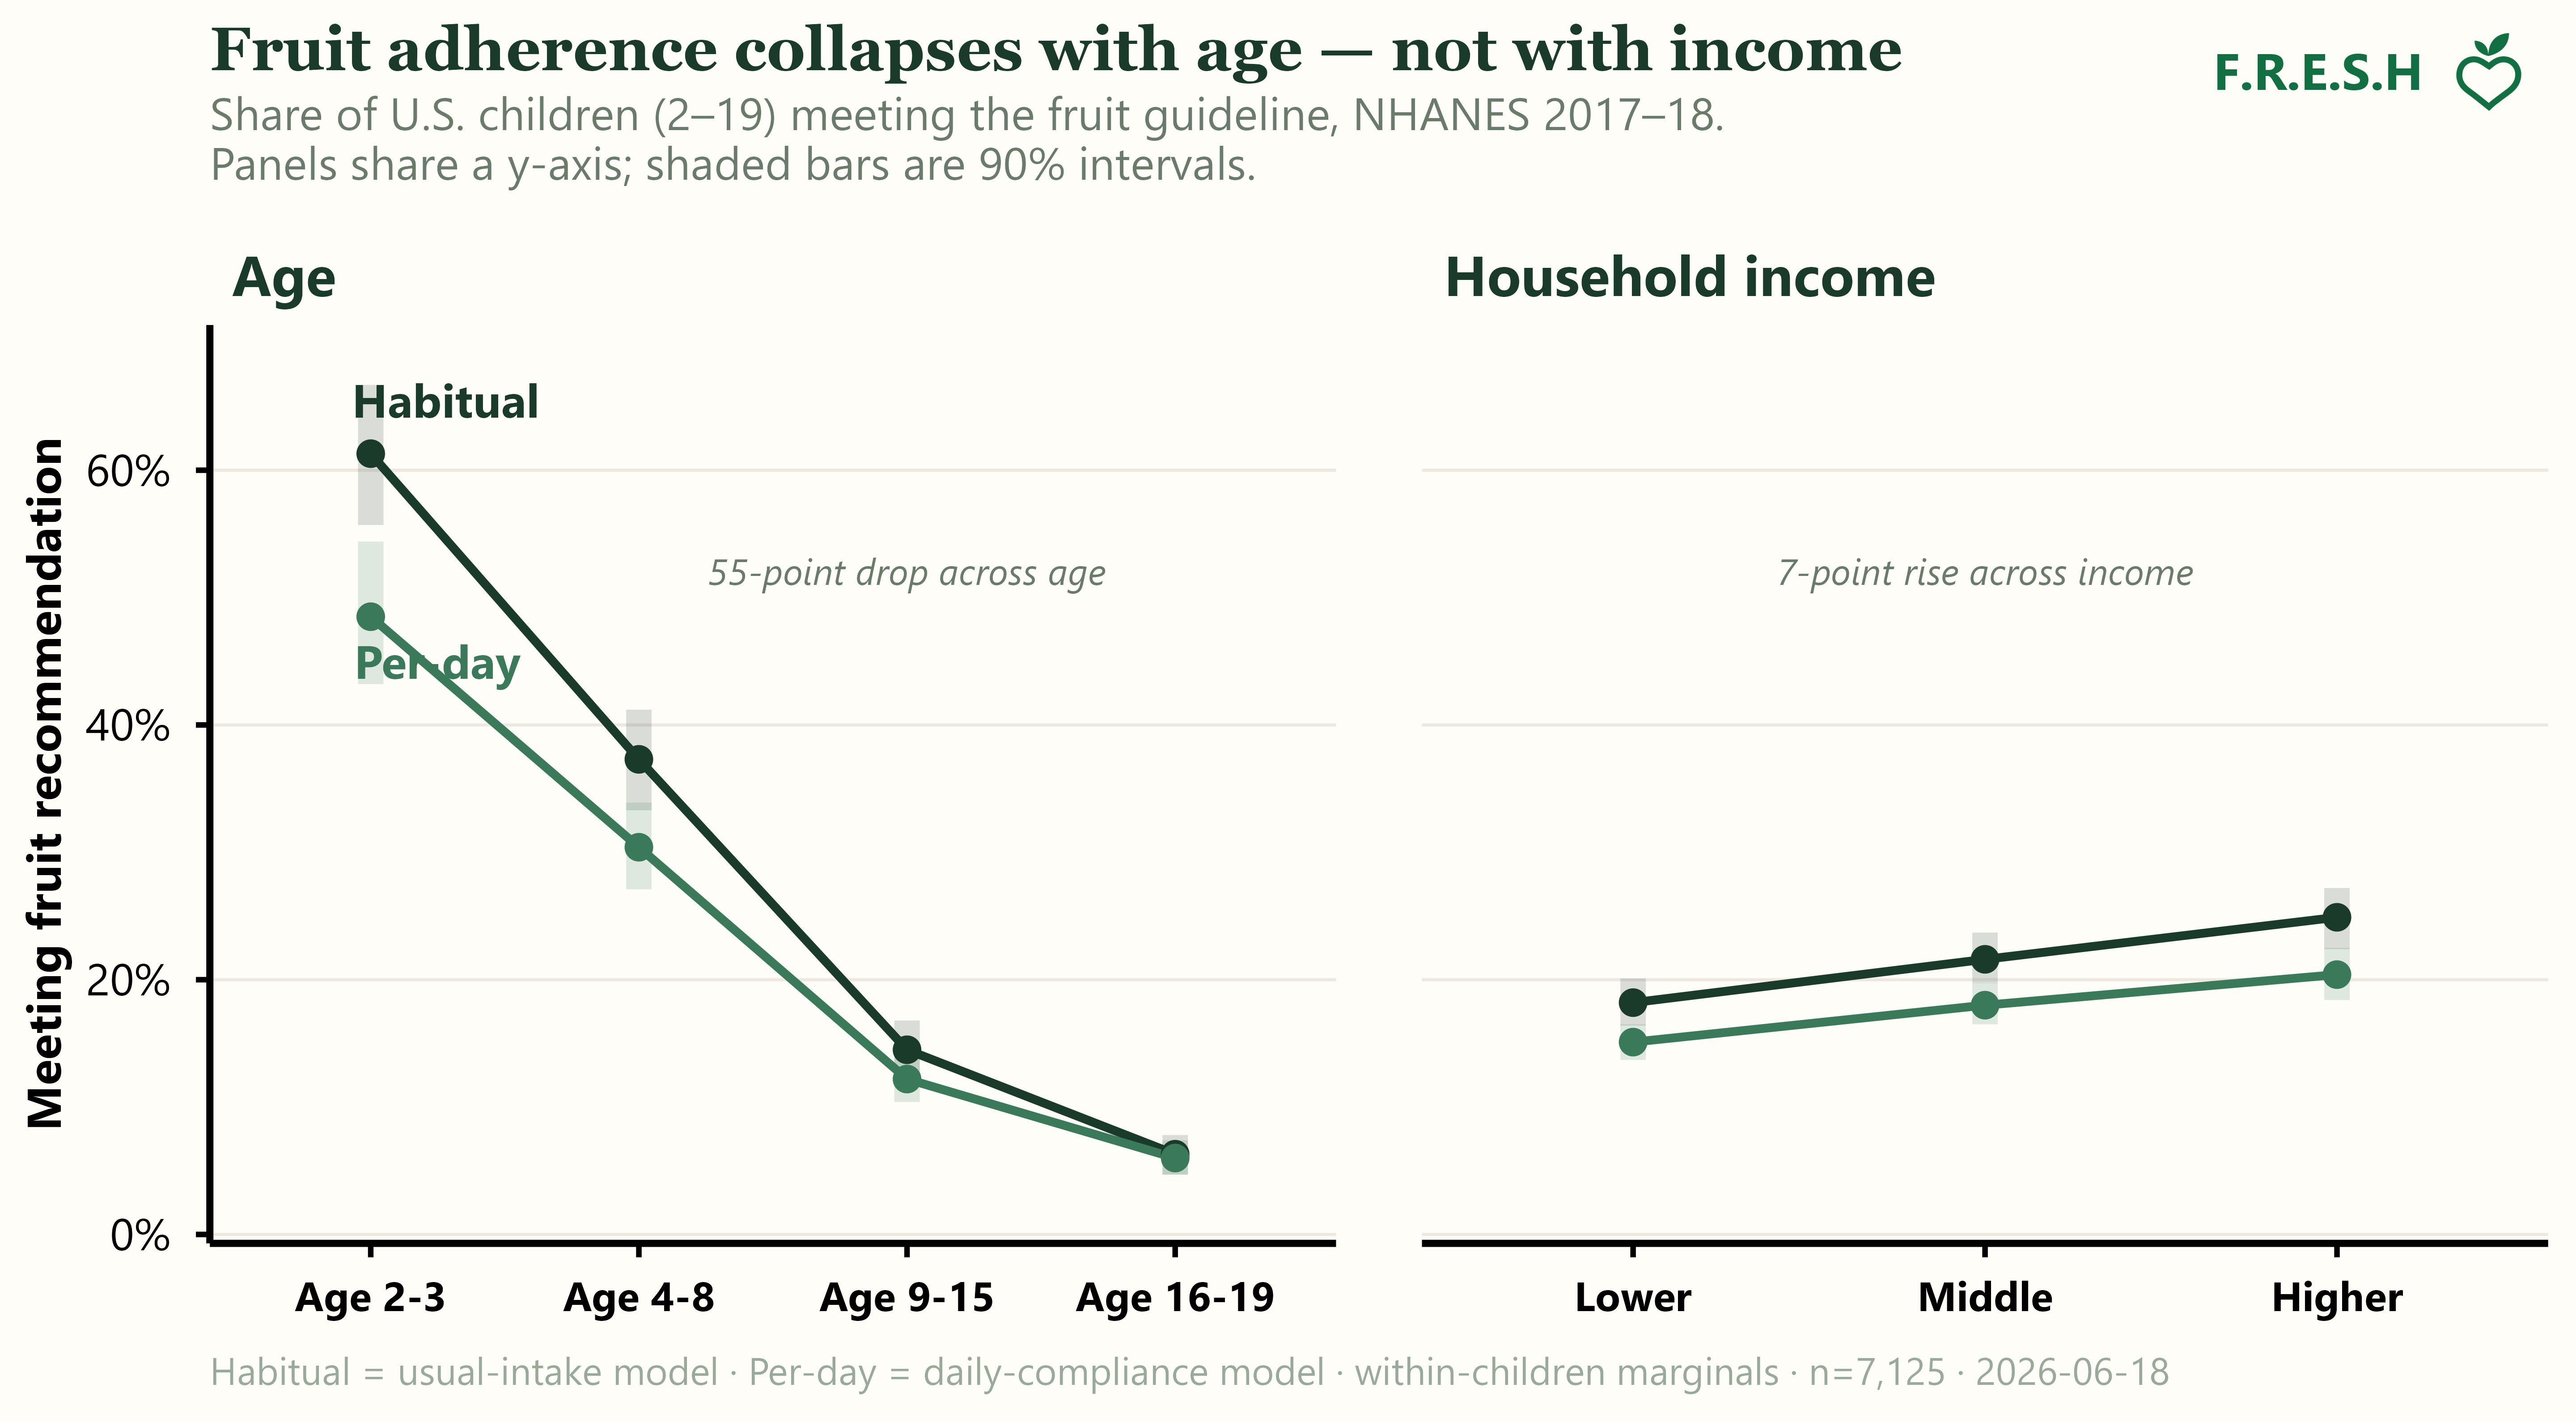
Within U.S. children, fruit-guideline adherence drops from roughly 60% among the youngest to 6% by the teen years — a collapse the single national figure averages away. The gap tracks age far more than income or price.
USDA reports that about 23% of American children get enough fruit. The number is right — but it’s close to useless if your job is getting more kids to eat fruit, and it quietly props up a story that doesn’t hold.
The trouble is that “23% of children” is an average. Roughly 6 in 10 toddlers clear the bar; about 6 in 100 teenagers do. The word “children” is hiding a cliff.
First you reproduce the number. Then you get to argue with it.
USDA’s Economic Research Service recently published its fruit-consumption trends report (ERR-341).1 It uses the National Cancer Institute’s usual-intake method — the right tool. It models habitual intake instead of naively averaging two recall days, and it respects the survey design. For 2017–March 2020 it reports 14.7% of adults and 23.2% of children meeting the fruit recommendation.
That ERS number is where I started. Building on our previous work2, before I’d trust our own pipeline to say anything ERS didn’t, I wanted it to agree where ERS already had an answer. So I estimated the same quantity on NHANES three ways: the NCI two-part method (13.8% overall), a multilevel small-area model — the kind political scientists use to estimate opinion in all 50 states from one national poll (14.6%) — and a small-area model of per-day compliance (12.1%).
| Population (NHANES 2017–18) | USDA-ERS3 | NCI 2-part (ours) | Small-area model (habitual) | Small-area model (per-day) |
|---|---|---|---|---|
| Children 2–19 | 23.2 | — | 21.9 | 18.1 |
| Adults 20+ | 14.7 | — | 12.4 | 10.4 |
| Total 2+ | 16.64 | 13.8 | 14.6 | 12.1 |
Source: FRESH dietary surveillance and equity pipeline (NCI two-part · Box-Cox MRP), NHANES 2017–18; USDA-ERS column from ERR-341.
Same neighborhood, three engines, matching USDA. The agreement is the least interesting thing in this post. It’s the price of admission.
The estimator isn’t the problem. The resolution is.
I want to be precise here, because it’s easy to strawman: USDA is not doing this wrong. They use usual intake. They split children from adults. The public tables are honest.
The problem is that the unit of reporting — “children,” “adults” — is far coarser than the unit of action. Nobody designs a fruit campaign for “children.” They design it for 4-year-olds, or for teenagers, or for a specific income tier in a specific community. And the moment you look at that resolution, the single number dissolves into something far more useful.
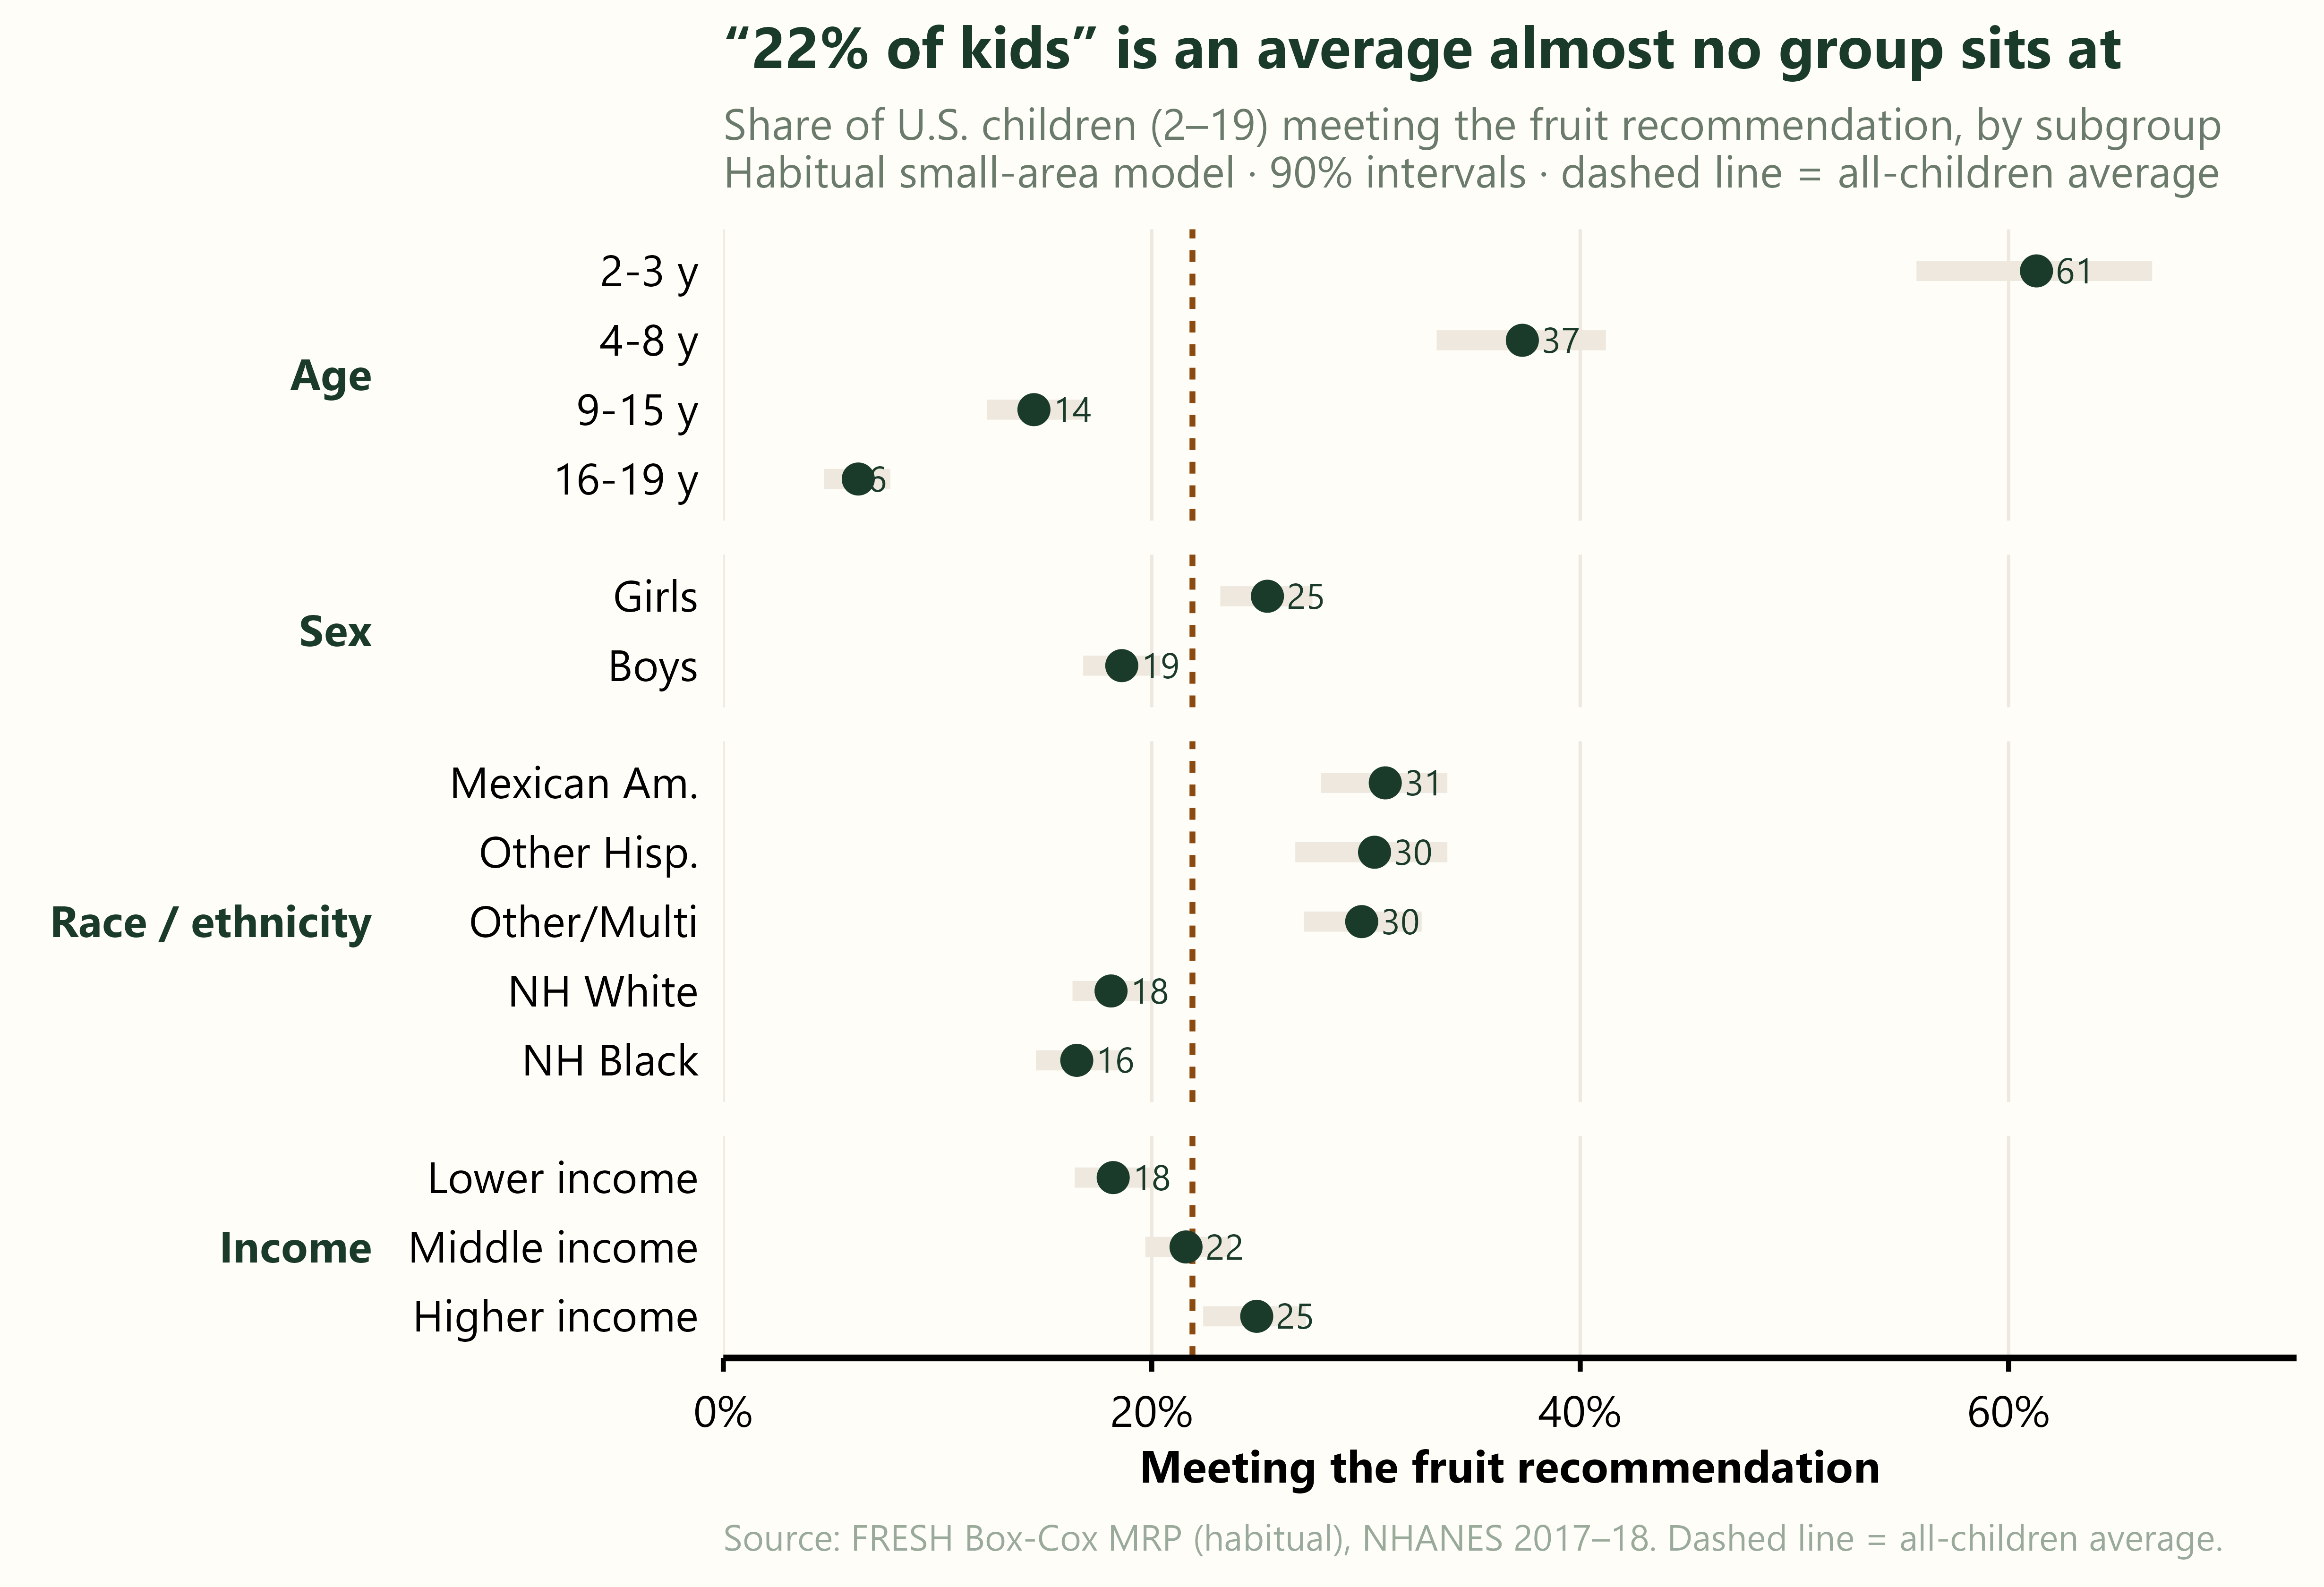
The age cliff dominates the figure, but the gap keeps splitting below the child-vs-adult line that usually gets reported: girls clear the bar more than boys5, Hispanic and multiracial kids run nearly double non-Hispanic White and Black kids, and adherence climbs monotonically with income.
None of that is visible in “23%.” All of it is in the same data.
“Fruit is expensive” explains less than you’d think
The standard explanation for a gap like this is cost, and it deserves to be taken seriously. A widely cited meta-analysis put the healthiest diets at about $1.50 a day more than the least healthy ones6, and affordability anchors much of the ultra-processed-food debate: lower-income families, the argument goes, can’t afford fresh produce, so you can’t simply tell them to trade chips for fruit7. There’s real evidence behind the worry.
And there is an income gradient here — lower-income kids at 18%, higher-income at 25%. The story isn’t wrong. It’s just small.
Put it next to the age cliff and it nearly disappears. The age gap is 55 points; income is 7. The income gradient is about 12 cents on the dollar of the age gradient, and that holds whether you measure in points or in ratios (≈10× across age, ≈1.4× across income).
It also can’t explain who’s actually winning. The highest-adherence kids in the country aren’t the richest. Non-Hispanic White kids, higher-income on average, sit at 18% — behind Mexican-American kids at 31%. Income isn’t even the through-line within the gradient: non-Hispanic Black kids are low (consistent with the cost story), but Hispanic kids — cutting the opposite way — are the highest in the country. One variable doesn’t move both directions.
That a single cost variable can’t carry the gap is exactly what USDA’s own report finds from the other side. In their model, household income and fruit prices have less influence on whether someone meets the recommendation than behaviors that signal concern for health and nutrition knowledge.8
None of this says cost doesn’t matter — Rao’s $1.50 is real, food deserts are real, and a 37% relative gap by income is worth closing. It says that for this gap, in fruit, cost is a second-order lever. Reach for “they can’t afford it” first and you’re tuning the smallest dial on the board — and stepping over a 55-point age collapse.
But “age” isn’t an answer either
So if it isn’t price, is it age? Not really. “Age” is a container, not a cause — knowing the gap lives in teenagers tells you where to look, not why it’s there. And part of the cliff isn’t behavior at all: the recommendation itself climbs from about one cup for a toddler to two for a teenager, so the bar rises at the very moment intake falls. The raw age effect quietly mixes a moving target with a real decline.9
Pull those apart and the explanations that are easy to reach for are social ones. The literature (a quick, non-systematic read — this is an essay, not a manuscript) has a familiar list for why fruit fades from childhood to adolescence: parents stop cutting it up and handing it over, kids gain autonomy over their own plates, home availability drops, peers and the market move in.10 Toddlers are handed fruit; somewhere in adolescence they take the plate over, and fruit slides off it. It’s a plausible story — I’m just not sure it’s the whole one. (It isn’t simply a switch off juice, at least: juice and whole fruit fall together. And the companion note turns up a longer-range pattern the tidy autonomy-and-market story doesn’t obviously survive.)
If the cliff is social rather than biological, “age” is the wrong name for it — so what kind of variable is it? Part of the rising bar is plainly biological — bigger bodies need more food. But the fruit falling off the plate seems to be something else. Nothing in a teenager’s physiology rejects an apple; what changes looks social — who controls the plate, what’s in the vending machine, what a snack signals among friends, what the market is selling. If that read is right, the cliff is a social transition wearing a biological variable’s clothing.
Which makes the way we usually handle age a little strange. Much of geroscience treats it as the thing to measure — epigenetic clocks, biological-age scores, age read off the body to a decimal. A lot of health-inequality research does closer to the opposite, age-standardizing to net age out so the “real” social variables can show through. (Nutrition and life-course researchers do take the age decline seriously — to be fair — so this isn’t “nobody looks”; the narrower point is how age gets handled once the frame is inequality.) Either way, the fruit cliff is a social gradient that one tradition over-measures as biology and the other adjusts away — and, at least in these data, it may be the steepest one in the picture. That seems like a variable to study, not to adjust away. And it isn’t only fruit, or only children: the same lens would change how we read income, race, even old age — each of which we tend to treat as fixed when it’s at least partly built.
Design the estimate for the decision, not the press release
The aggregate “14%” or “23%” isn’t really a measurement. It’s a measurement collapsed to one number so it fits in a sentence. That’s fine for a headline and useless for a campaign.
So if you’re testing a message, you don’t need the average. You need to know the gap sits in the teen years, barely moves with income, and doesn’t follow the affordability script at all — and you need the estimate built at that resolution, with honest uncertainty, on a survey that was never designed to be sliced this thin. That’s a design problem: build the estimate to answer the targeting question you actually have, not the one that fits the press release — or the one that fits your prior about why poor people eat less fruit.
That’s the discipline behind reproducing USDA’s number in the first place: we earned the right to say it isn’t the number you want. The number you want — and the place you should actually be aiming, even if you don’t yet know why it’s there — was inside it the whole time.
Information can be health — but only at the resolution where someone can act on it.
Analysis: FRESH dietary surveillance and equity pipeline.
If you want to go deeper:
- USDA ERS, Trends in U.S. Fruit Consumption Relative to Recommendations in the Dietary Guidelines for Americans (ERR-341): https://www.ers.usda.gov/publications/pub-details?pubid=110657
- The companion Amber Waves piece, “Peeling Open U.S. Fruit Consumption Trends”: https://www.ers.usda.gov/amber-waves/2025/february/peeling-open-us-fruit-consumption-trends
- The National Cancer Institute’s usual-intake method: https://epi.grants.cancer.gov/diet/usualintakes/
- Our prior framework paper (the 100% orange juice case study), where this fruit-adherence pipeline started: https://doi.org/10.1080/09637486.2023.2241672
Footnotes
Stewart, H., Young, S. K., Dong, D., & Byrne, A. T. (2024). Trends in U.S. Fruit Consumption Relative to Recommendations in the Dietary Guidelines for Americans (ERR-341). USDA Economic Research Service. Estimates use NCI’s episodic two-part model (MIXTRAN + DISTRIB) with balanced repeated replication weights.↩︎
Erndt-Marino, J., O’Hearn, M., & Menichetti, G. (2023). An integrative analytical framework to identify healthy, impactful, and equitable foods: a case study on 100% orange juice. International Journal of Food Sciences and Nutrition, 74(6). https://doi.org/10.1080/09637486.2023.2241672. The fruit-adherence estimates here build on that paper’s usual-intake + multilevel-poststratification approach on NHANES 2017–18.↩︎
ERS pools 2017–March 2020; our estimates are NHANES 2017–18. Both pre-pandemic.↩︎
ERS reports no 2+ total; this is its child/adult estimates blended on our census population mix (≈23% children / 77% adults). NCI 2-part shown national-only.↩︎
Mostly a denominator effect: girls eat about the same fruit as boys (≈0.88 vs 0.90 cup-eq usual intake) but face a lower recommendation, so they clear it more often. Unlike the race and income gaps, which are real intake differences. Detail in the companion robustness note.↩︎
Rao, M., Afshin, A., Singh, G., & Mozaffarian, D. (2013). Do healthier foods and diet patterns cost more than less healthy options? A systematic review and meta-analysis. BMJ Open, 3(12), e004277. https://doi.org/10.1136/bmjopen-2013-004277. Across 27 studies in 10 countries (mostly high-income), the healthiest diet patterns cost about $1.48/day more ($1.01–$1.95) than the least healthy.↩︎
Belak, L., Zlotshewer, B., Dastmalchi, L. N., Klodas, E., Kris-Etherton, P. M., & Aggarwal, M. (2025, January 6). Ultra-processed foods: the enemy in the food system? Cardiology Magazine, American College of Cardiology. The piece notes lower-income individuals “may also not be able to afford fresher, notoriously more expensive foods, and thus purchase low-cost UPF more often.”↩︎
Per ERR-341: “Fruit prices and household income have less influence” than “behaviors such as smoking, exercising, and awareness of MyPlate … which indicate a consumer’s level of concern for health.” Our income gradient is a descriptive marginal; ERS’s is a covariate-adjusted effect — different objects, same direction.↩︎
We pull the two apart in the companion robustness note. Toddlers eat roughly double the fruit teenagers do (≈1.3 vs 0.7 cup-eq usual intake), and on a log scale the collapse splits about 54% real intake decline / 46% rising bar — the bar matters, but it can’t carry the cliff alone. Interesting, not determinative.↩︎
A quick, non-systematic look — not a literature review. The canonical reference is Rasmussen, M., et al. (2006). Determinants of fruit and vegetable consumption among children and adolescents: a review of the literature. International Journal of Behavioral Nutrition and Physical Activity, 3, 22, which finds intake declines with age and points to parental support, autonomy, preferences, and home availability. (See the companion note for a longer-range pattern these mechanisms don’t obviously explain.)↩︎